
How to enable remote debugging for Chrome browser, supports Windows and MacOS, Linux
Calendar
👁️ 2251
The following are the methods to enable remote debugging of Chrome browser on various operating systems:
Windows operating system:
- Make sure you have installed Chrome browser and it is up to date.
- Open a Command Prompt window (press Win + R, enter "cmd", and then press Enter).
C:\Program Files\Google\Chrome\Application\chrome.exe" --remote-debugging-port=9222- In the command prompt window, enter the following command and press Enter:
If your Chrome installation directory is different, please modify the command accordingly.
- The Chrome browser will start in debug mode and listen on port 9222 to accept remote debugging connections.
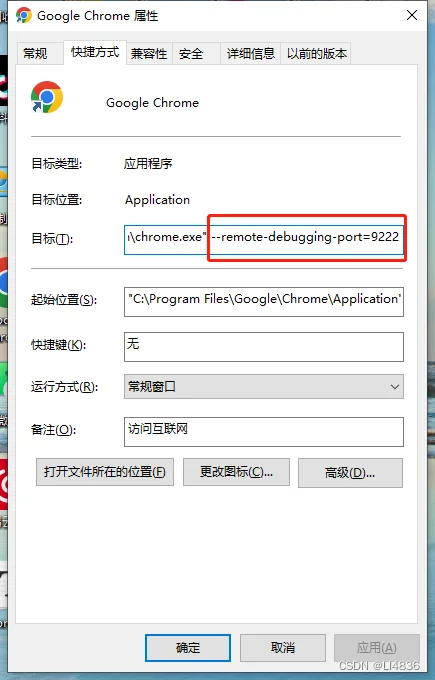
- Or directly modify the shortcut:
- Chrome browser shortcut, right-click to select 'Properties', add --remote-debugging-port=9222 in the target field, define the port yourself if necessary, and then start the browser.
macOS Operating System:
- Make sure you have installed Chrome browser and it is up to date.
- Open the Terminal application.
/Applications/Google\ Chrome.app/Contents/MacOS/Google\ Chrome --remote-debugging-port=9222- Enter the following command in the terminal and press Enter:
The Chrome browser will start in debug mode and listen on port 9222 to accept remote debugging connections.
Linux Operating System:
- Make sure you have installed Chrome browser and it is up to date.
- Open the Terminal application.
google-chrome --remote-debugging-port=9222- Enter the following command in the terminal and press Enter:
If
google-chromeCommand not found, please try usinggoogle-chrome-stableor similar commands. - The Chrome browser will start in debug mode and listen on port 9222 to accept remote debugging connections.
Note: The above method will enable remote debugging when starting Chrome browser, but make sure that your operating system and firewall settings allow access to the specified debugging port.